The Long View 26 Years of DC Row Home PricingMedian price per square foot, 2000 to 2026. Five neighborhoods. Where has the value actually been created? |
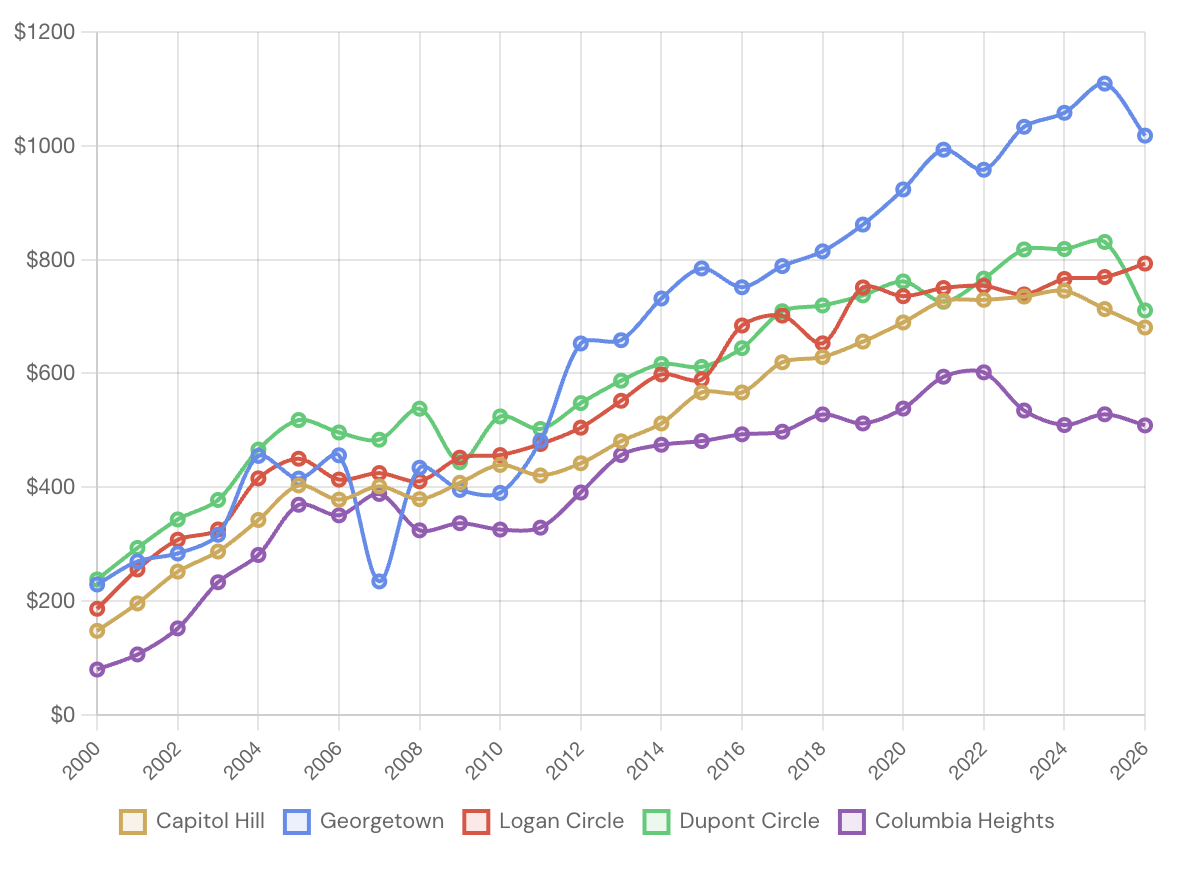 Median $/sqft · Fee simple row homes · Source: brianhill.co |
Brian's Take |
Columbia Heights delivered a 544% total return since 2000, the highest in this group. Georgetown's was 345%. The neighborhood everyone overlooks outperformed the one everyone covets by 200 percentage points. But Columbia Heights peaked at $602 in 2022 and has since fallen 15.4% to $509. Dupont Circle had the sharpest single-year drop: down 14.4% to $711. Logan Circle is the only neighborhood at its all-time high right now at $793. Three of five neighborhoods are declining. The gap between highest and lowest $/sqft has widened from $159 in 2000 to $509 today. Neighborhood selection is the single largest determinant of return, more than timing, more than rate cycles. |
Biggest Gainer 544% Columbia Heights |
| At All-Time High $793 Logan Circle |
| Widening Spread $509 High-to-low gap |
|
|
Neighborhood by Neighborhood |
Georgetown $229 → $1,018/sqft · 345% total · 5.91% CAGR Highest absolute $/sqft in DC. Commands a 49.5% premium over Capitol Hill, up from 55.8% in 2000. Currently 8.3% off its 2025 peak of $1,110; the post-2011 run from $482 was one of the most consistent appreciation streaks in the city. |
|
Logan Circle $186 → $793/sqft · 326% total · 5.74% CAGR The only neighborhood at its all-time high right now. Barely flinched during the 2008 financial crisis (down 8.9%, recovered in 4 years). No boom-bust cycles. Just consistent compounding since 2016. That kind of stability is what institutional money looks for. |
|
Capitol Hill $147 → $681/sqft · 363% total · 6.07% CAGR Most resilient neighborhood in this group during the 2008 financial crisis; it dropped just 6% from peak and recovered in 4 years. Peaked at $745 in 2024 and has pulled back 8.6%. At $681, it's back to 2020 levels: a post-pandemic reversion, not a crash. |
|
Columbia Heights $79 → $509/sqft · 544% total · 7.43% CAGR Highest total return in the group but also the highest volatility. Peaked at $602 in 2022 and is down 15.4%, the steepest current drawdown. At $509, the neighborhood is repricing. Buying opportunity or structural shift? The 26-year data doesn't settle that question yet. |
|
Dupont Circle $238 → $711/sqft · 199% total · 4.30% CAGR Started as the most expensive neighborhood in 2000. Now third. Lowest CAGR in the group at 4.30% and the sharpest single-year drop: down 14.4% from 2025 to 2026. Higher starting prices left less room for the outsized early gains other neighborhoods captured. |
|
The Bottom Line Georgetown and Logan Circle share one trait: constrained supply and persistent demand that holds through downturns. The right neighborhood in the wrong year still beats the wrong neighborhood in the right year. Every time. |
Source: brianhill.co · Median $/sqft · Fee simple row homes · 2000–2026 |